A mapboard is a geographic artboard. In addition to width and height dimension properties, a mapboard has a scale property that describes the distance (and level of detail shown) on the map compared to the distance on the ground. All maps display on a flat surface (page or screen), showing some geographic extent at some scale.
Extent and scale
The following three map characteristics are interrelated to each other and essential when creating a map of a high quality:
- Geographic extent—The area on the ground that will be displayed in a map.
- Map scale—The ratio of the distance on the map to the corresponding distance on the ground.
- Output size—The size of the page or screen on which the area on the ground will be displayed.
Changing one characteristic can impact one or both of the others. The relationship of geographic extent, map scale, and output size (screen or paper) is much like the sides of a triangle. If you change the length of one side, the other two sides must be adjusted to maintain the geometry of the triangle.
The following example explains this more fully. The premise of this example is based on how a dynamic map is commonly viewed and interacted with on the internet through a standard web browser. In this case, the browser's window size is equivalent to the output size, which is the output viewing canvas for the map.
Say your browser window displays a map that is smaller than the full size of your display monitor. If you change the size of the browser window, the geographic extent (how much ground area is shown) of the map changes. In this workflow, changing one characteristic—for example, the map scale (level of detail or zoom)—and changing another characteristic—for example, the output page size (the browser window)—increases the geographic extent proportionally.
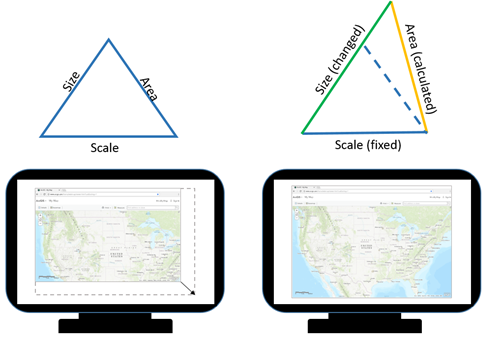
Similarly, changing the map scale (level of detail or zoom) by zooming in or out while the browser window size remains fixed also proportionally affects the geographic extent (map area). In the following workflow, the output page size is fixed, and the change of map scale or zoom level forces the map extent to also update to maintain the relationship.
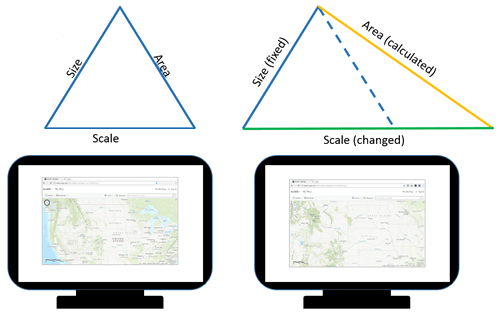
As these diagrams show, identifying two out of the three essential characteristics allows the third one to be calculated automatically. This is an important concept that is the basis for using the Mapboards window in this extension.
Examples
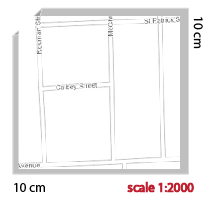
Imagine that you want to map a city block. In the real world, the block measures 100 square meters. Start by creating a map that is 10 by 10 centimeters of output size in page units. In that case, the scale is 1:1000, meaning that 1 centimeter on the map represents 1000 centimeters (10 meters) on the ground.
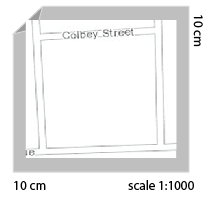
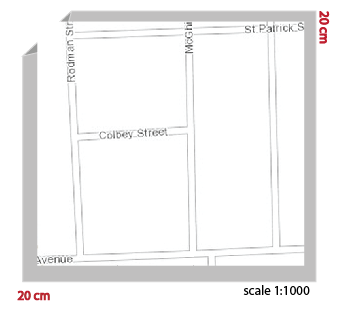
If you decide you want the map to include the entire neighborhood, you will need to adjust the extent. To accommodate this change, either the dimensions or scale must also change. For example, you could increase the map dimensions to 20 by 20 centimeters.
Alternatively, you could switch to a smaller scale of 1:2000. The visual effect is similar to zooming out. Now, 1 centimeter on the map represents 2000 centimeters (20 meters) on the ground.
Vous avez un commentaire à formuler concernant cette rubrique ?